Quantum Optics
LabFoton-UC: photonics and nonlinear optics laboratory
Quantum Optics
LabFoton-UC: photonics and nonlinear optics laboratory
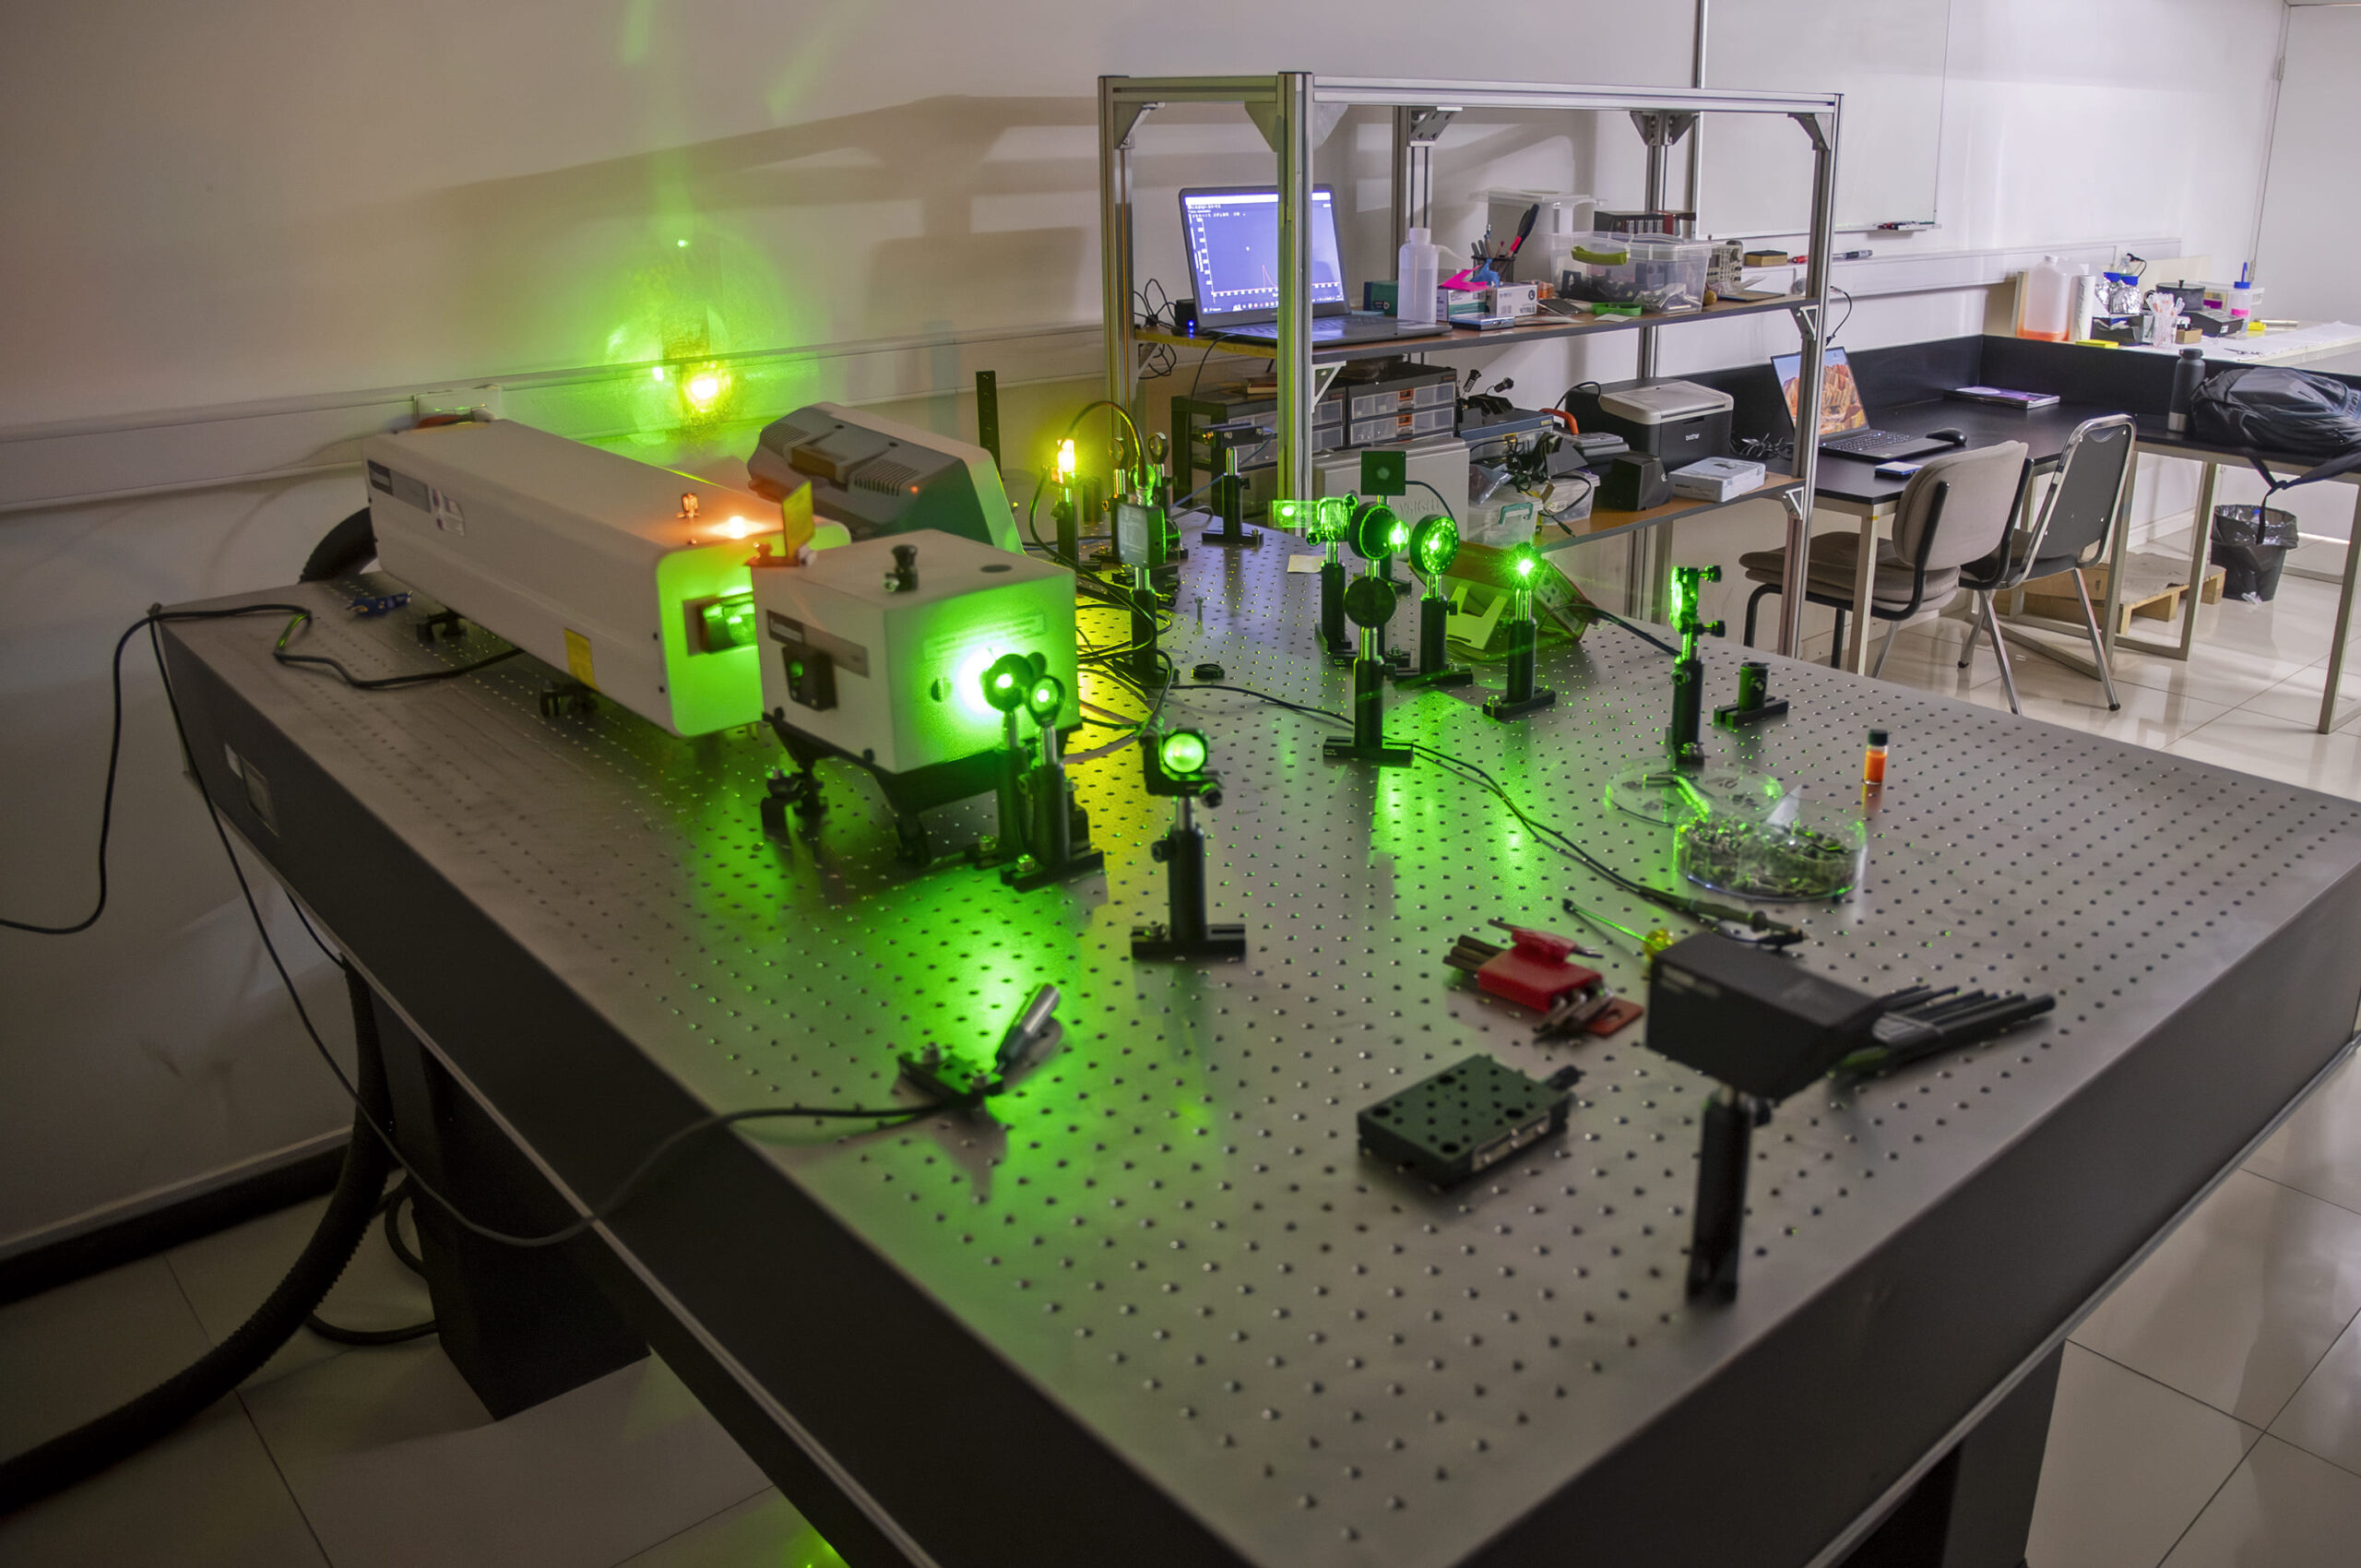
Nanosecond laser Nd:YAG
Nanosecond laser Nd:YAG (1064nm, 532nm, 266nm): The second harmonic of the laser (a wavelength of 532nm) was selected for this experiment. The optical path of the beam can be seen in the photograph.
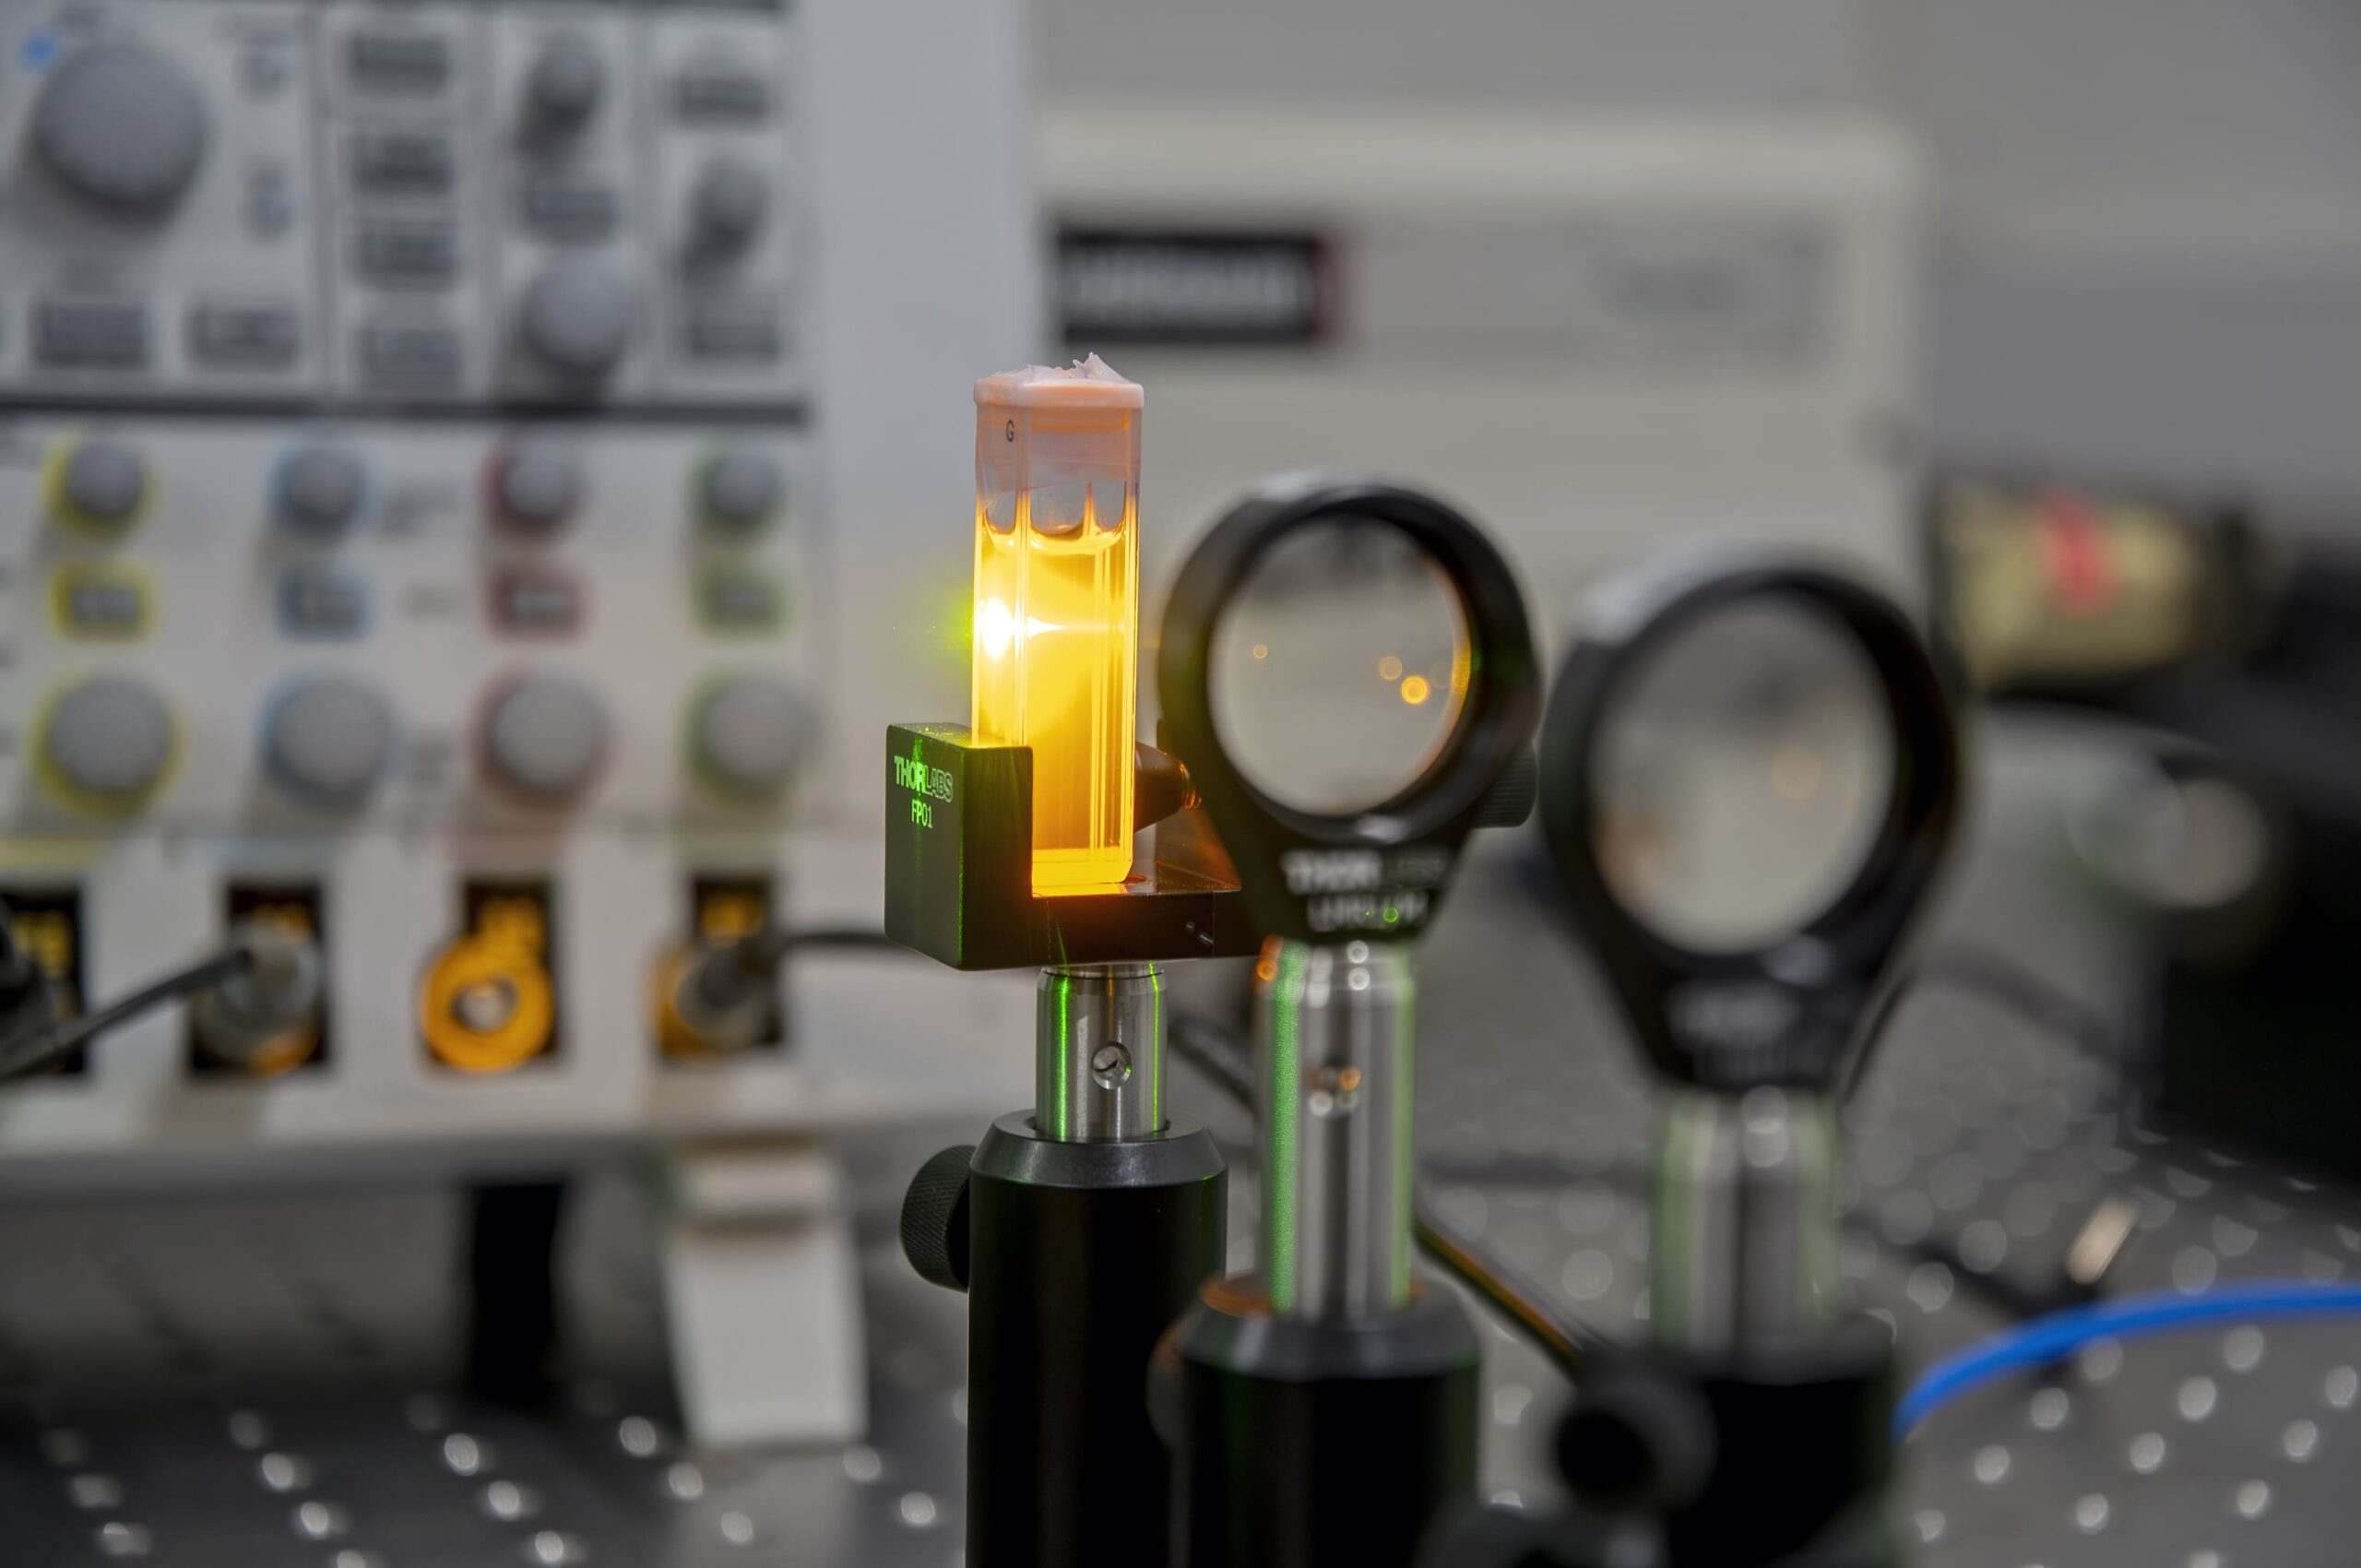
Detection system
Collimation of the emission spectrum and focus on the optical fiber, which is connected to a spectrophotometer. The study sample consists of TiO2 nanoparticles suspended in a solution of rhodamine 6G (a dye) dissolved in ethanol. Rhodamine 6G emits a fluorescence spectrum around 550nm (that is why we observe a yellow color when irradiated with green light). As we increase the power that the sample irradiates, the TiO2 nanoparticles begin to produce optical feedback and we observe a spectrum with a significant reduction in its length at half height (FWHM).
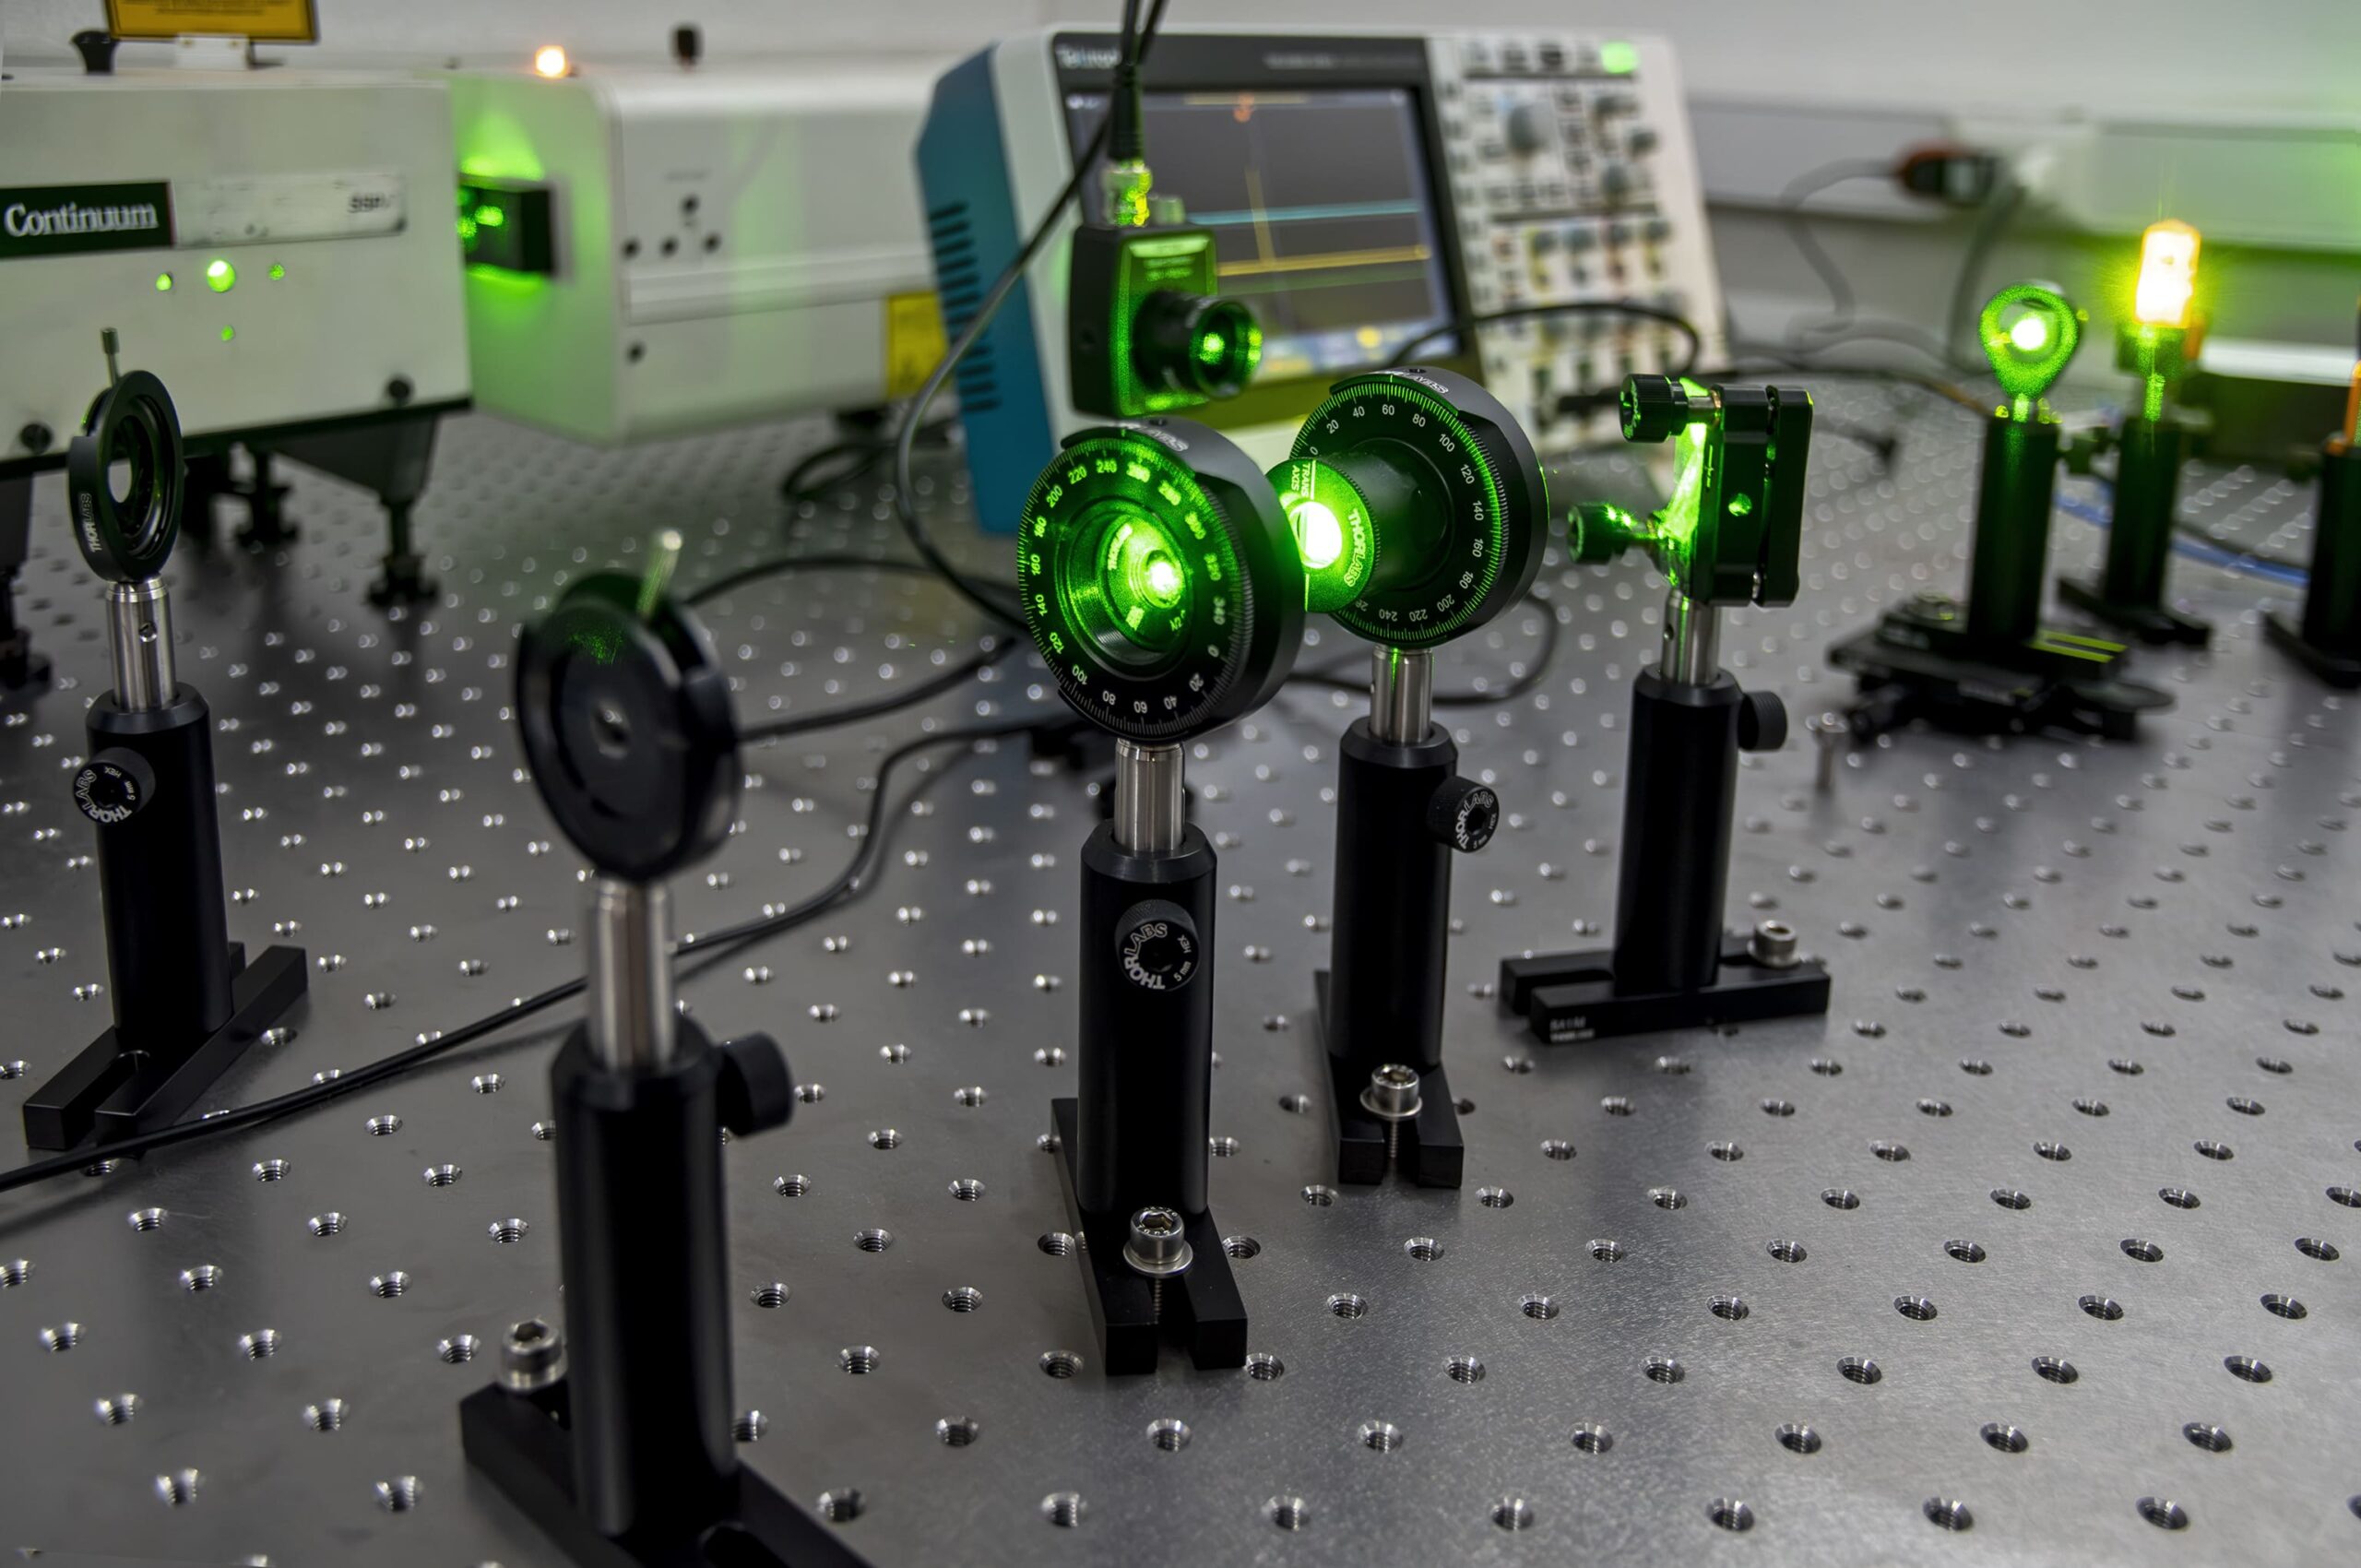
Power control system
We use a half-wave plate and a cube polarizer to control the power that affects the sample. With a photodetector connected to an oscilloscope we can more efficiently control the power of the beam.
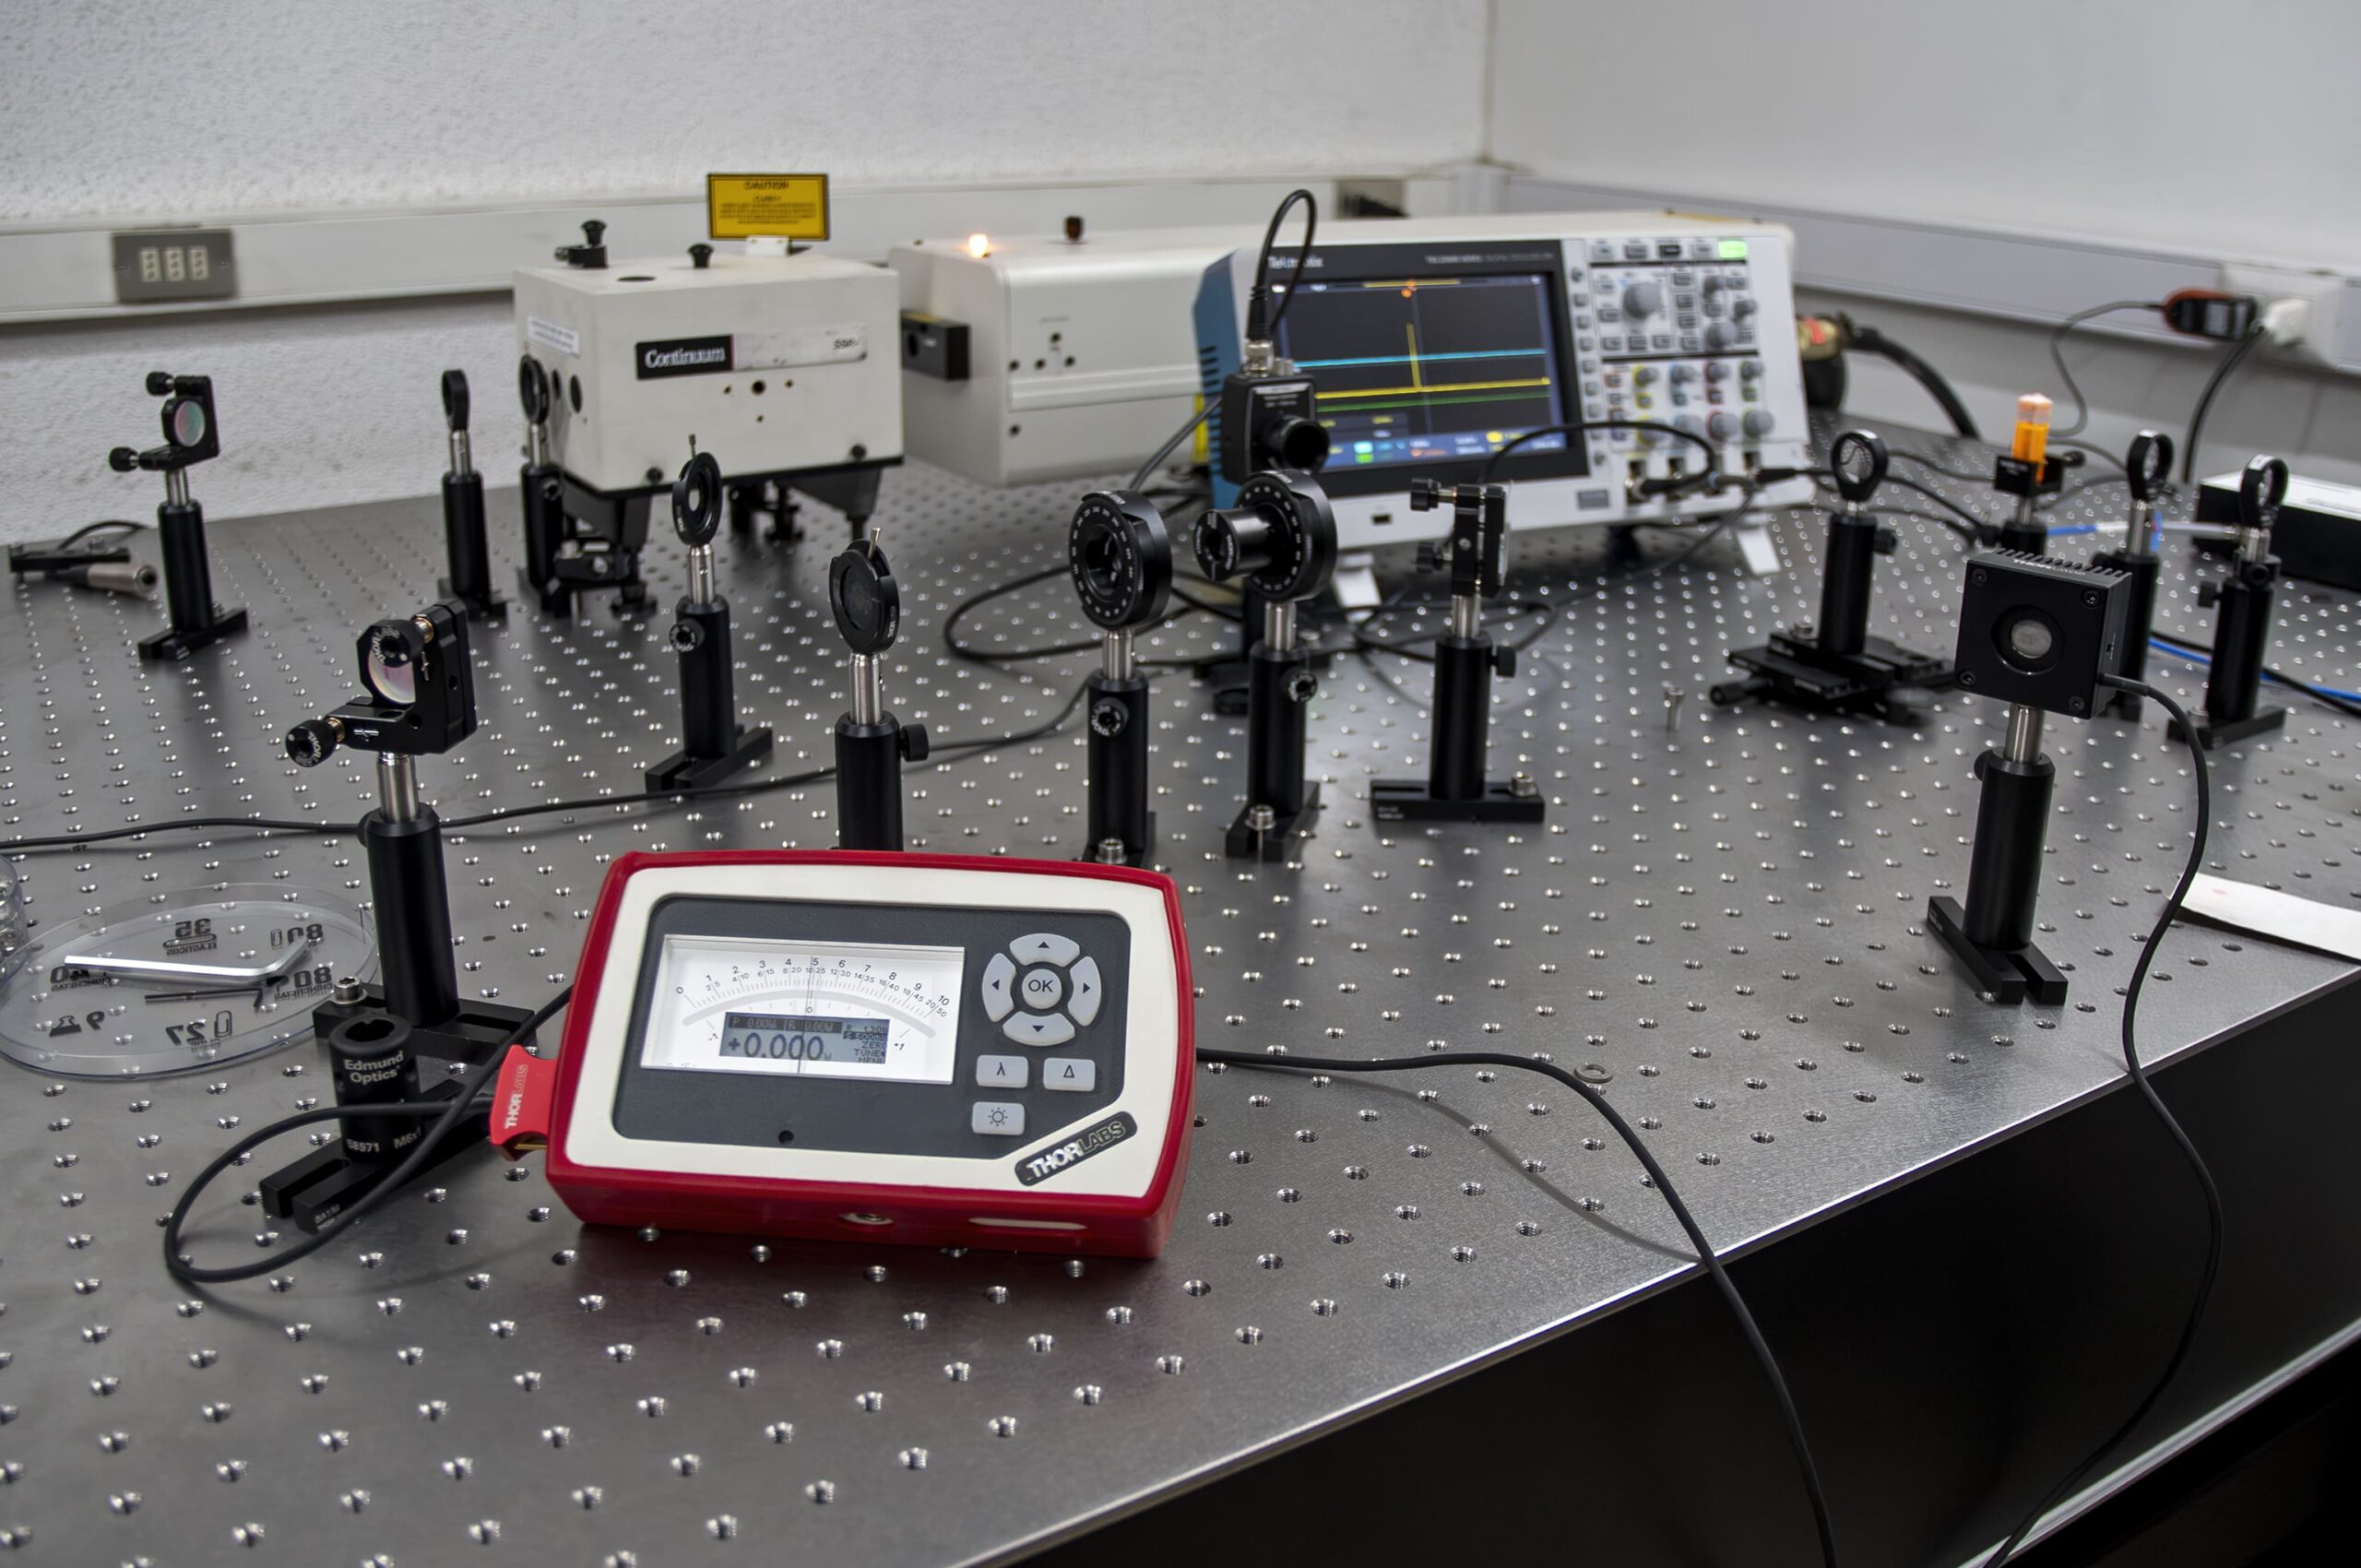
Power meter
Optical power meter connected to a thermopile capable of measuring up to 10W of average power.
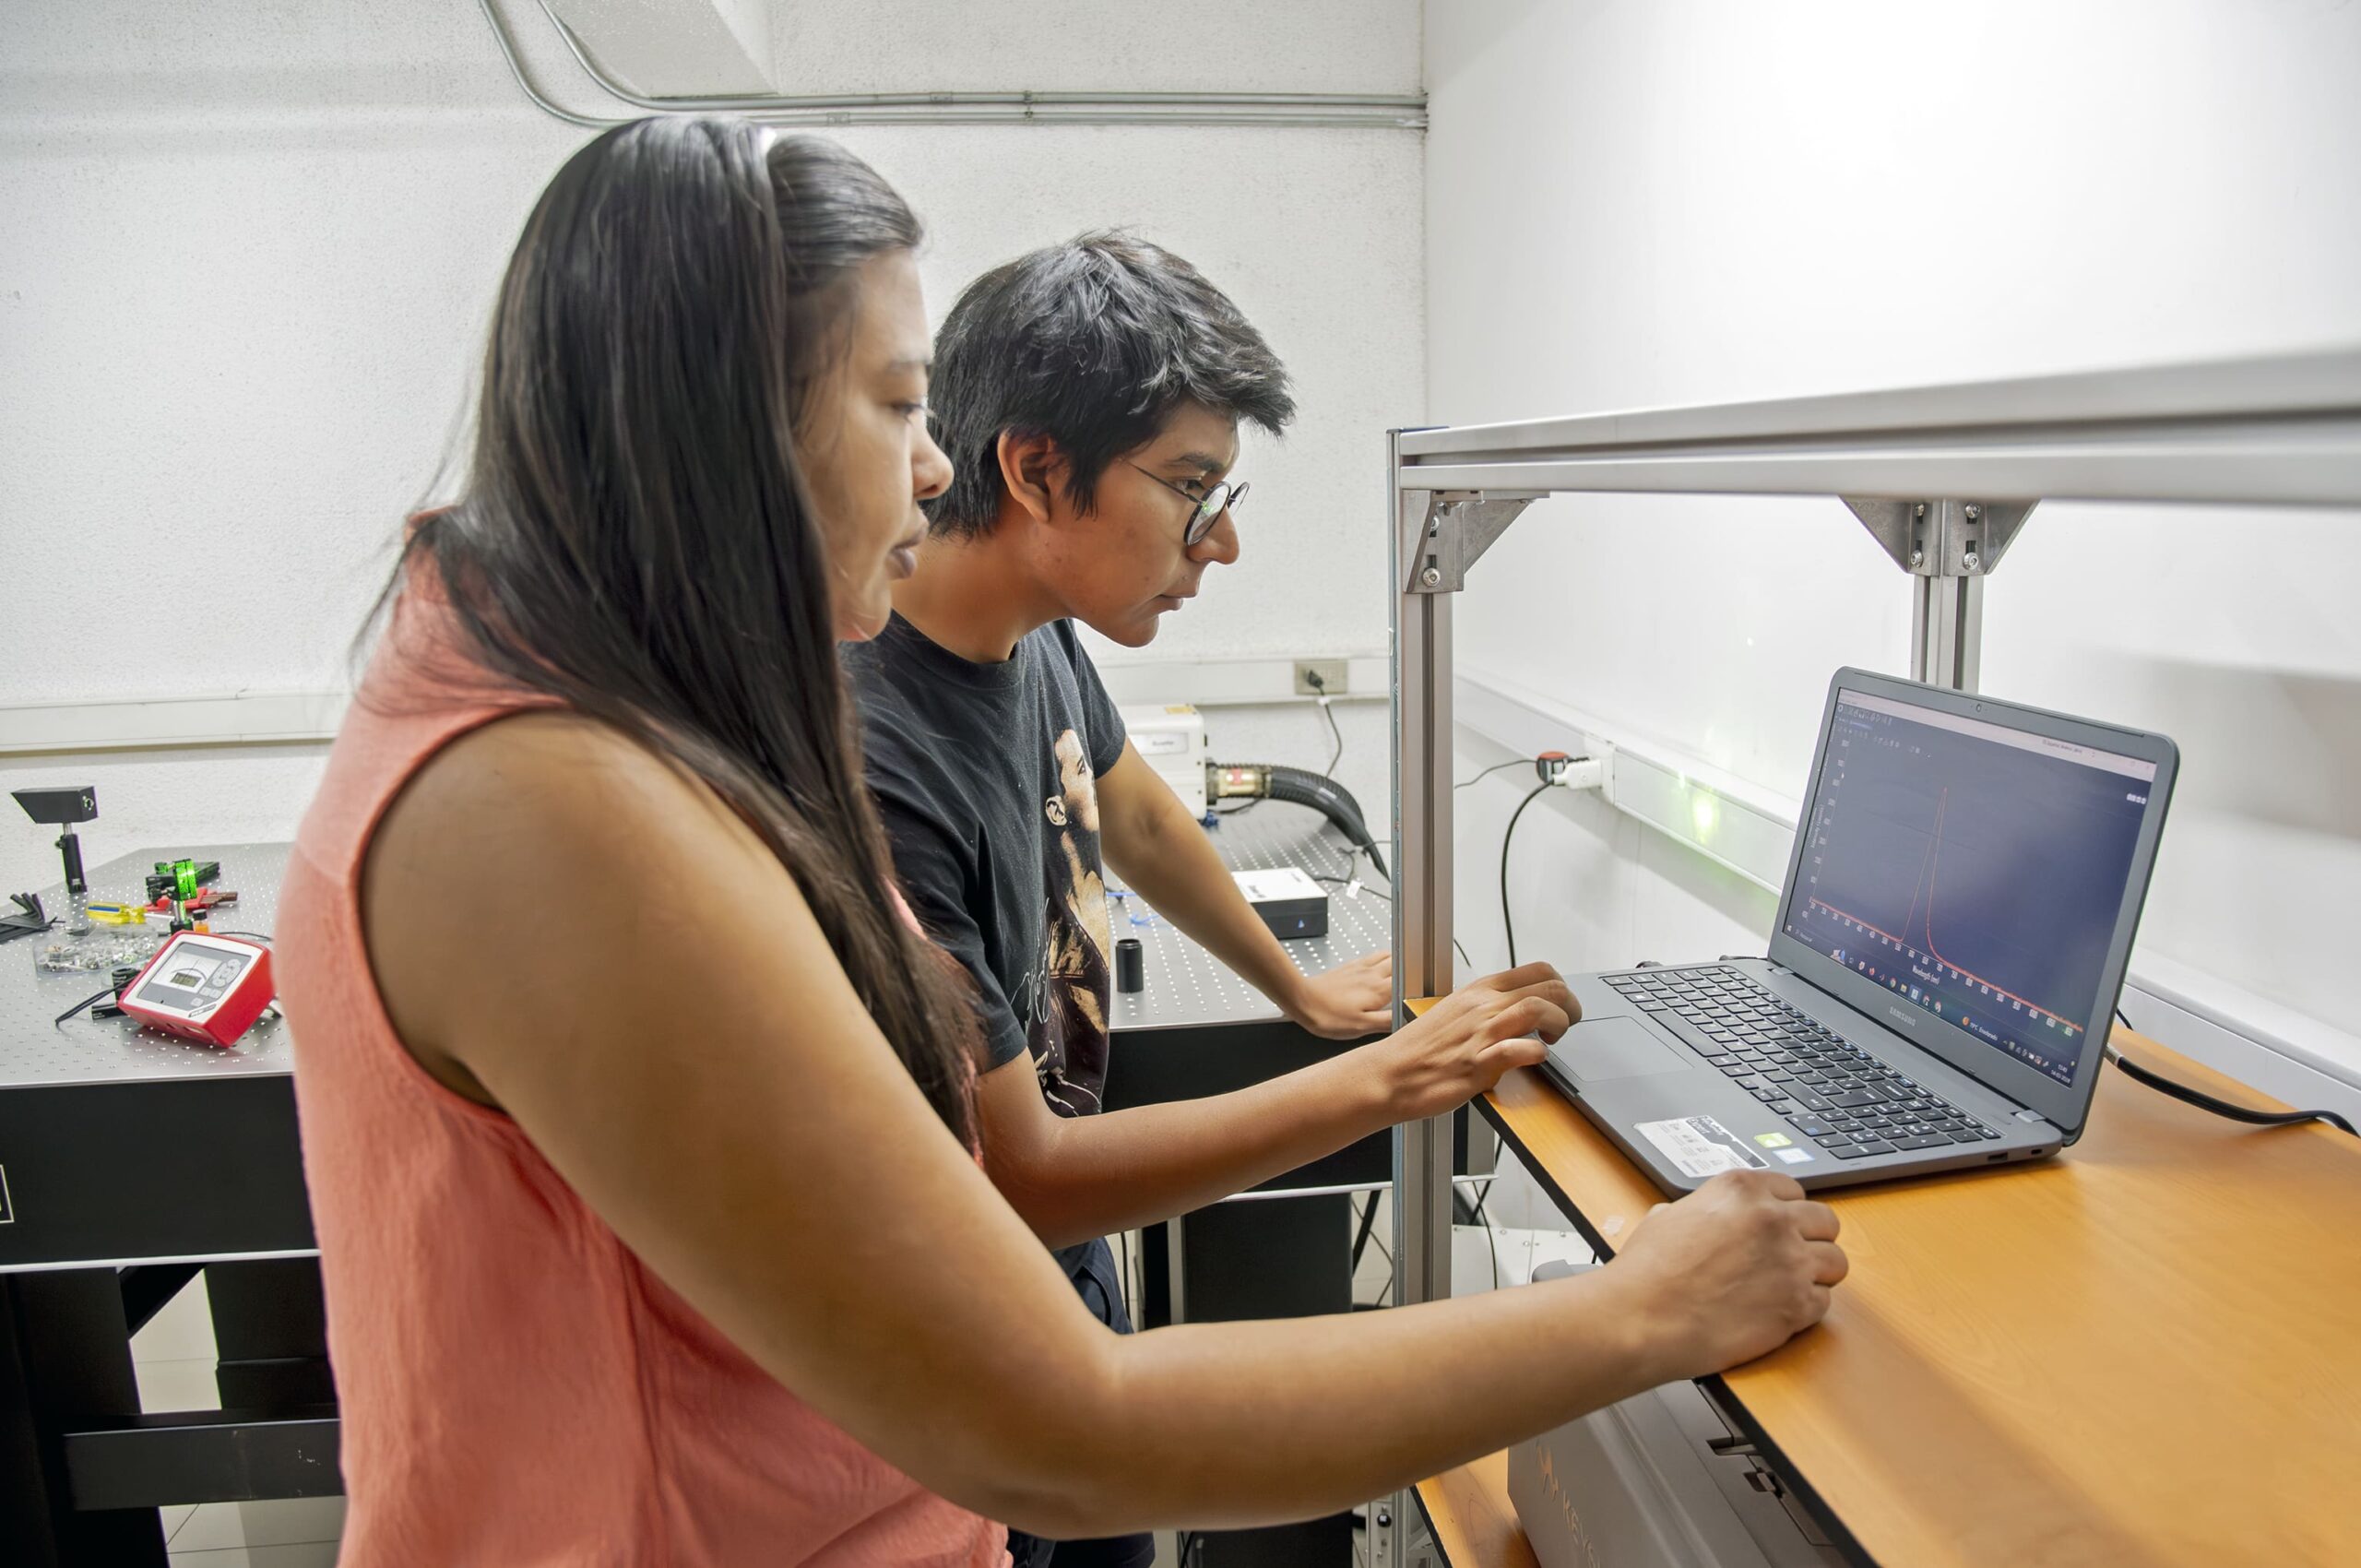
Data collection system
Through the spectrophotometer software we are able to visualize and carry out data acquisition. On the screen we observe the spectrum of emission of TiO2 nanoparticles suspended in rhodamine 6G.
Welcome to the LabFoton-UC laboratory: Photonics and Nonlinear Optics laboratory
Directed by professor Melissa Maldonado. In this laboratory we carry out experimental research in Quantum Optics .
We invite you to click on each of the highlighted points to learn more about our techniques and equipment.